-
Analyzing aquatic biological data
Categories: Estimated reading time: 2 minutes
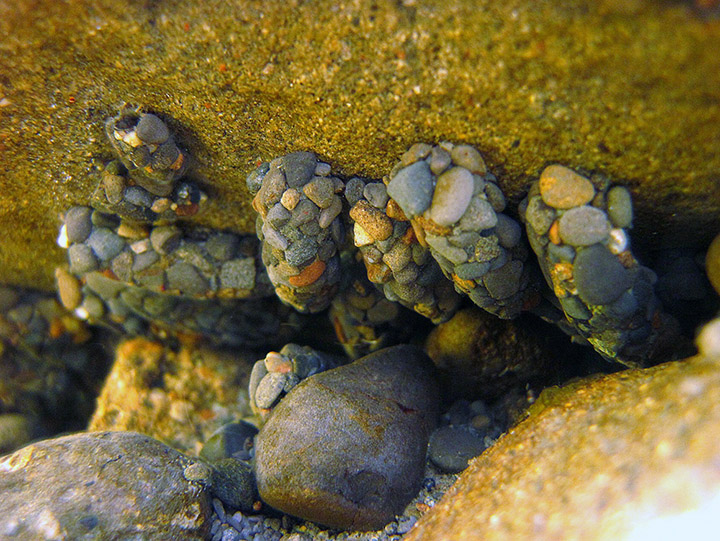
Regulatory and resource agencies sometimes require collection of benthic macroinvertebrates and/or fish for baseline data or permit compliance. Too often they do not know what they will do with the data. Correctly analyzing and interpreting these data yields valuable information that operators and regulators can use to make well-informed decisions regarding Clean Water Act compliance. Aquatic biotic communities reflect ambient water quality conditions much better than do chemical concentrations. This is particularly true for benthic macroinvertebrates as they are less mobile than fish. -
Regulatory and resource agencies sometimes require collection of benthic macroinvertebrates and/or fish for baseline data or permit compliance. It is too common for them to not know what they will do with the data. Correctly analyzing and interpreting these data yields valuable information that operators and regulators can use to make well-informed decisions regarding Clean Water Act compliance. Aquatic biotic communities reflect ambient water quality conditions much better than do chemical concentrations.
-
Collecting sediment samples for analysis of contaminants—particularly in river systems—is not just a matter of going out with a bucket and shovel. In fact, it is much more complex than a water quality survey, aquatic biota survey, or any terrestrial sampling program. Monitoring of sediment contaminants frequently is done to determine whether the sediments are a sink or a source of the chemicals of interest, and to evaluate the effects of the contaminants on the aquatic ecosystem as a whole.
-
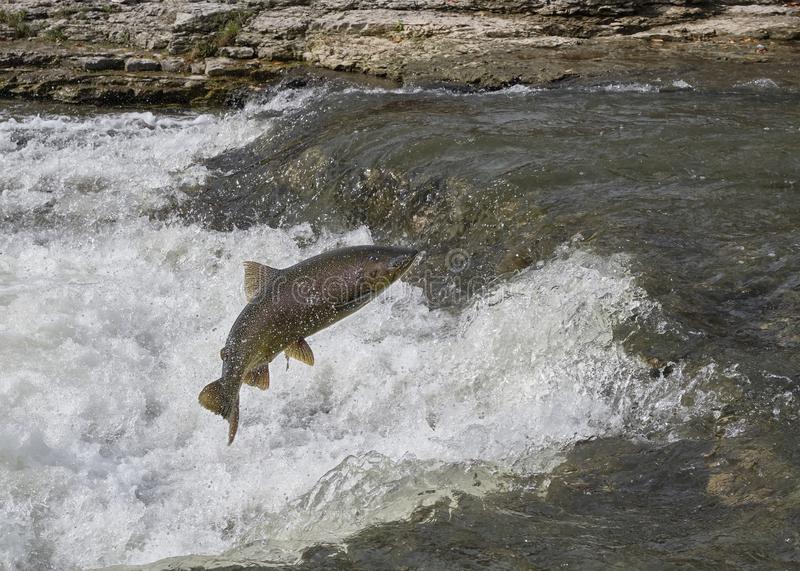
Sage-grouse, salmon, desert tortoise, and many other animals are listed under the Endangered Species Act (ESA) or are being considered for listing. Much data have been collected on population abundance, distribution, and habitat quantity and quality. Unfortunately, most biotic data are incorrectly analyzed because count data differ from continuous data and require different statistical models. Because ineffective policy decisions result from inappropriate models correct analytical results are critical for regulated industries, regulators, and other stakeholders.
-
From baseline conditions for environmental impact assessments to compliance with regulatory permit conditions regulated companies collect biological data and report analytical results to regulators and other interested parties. Historically, analyses used biotic diversity and integrity indices. These attempt to summarize highly complex natural ecosystems in a single number believed to make comparisons and decisions easier. While these indices are based on ecological theory they are very difficult, even impossible, to measure and quantitatively compare.
-
Natural resource companies, particularly in extractive industries, are expected to comply with standards of environmental stewardship and sustainability. Financial institutions subscribing to the Equator Principle require evidence of such compliance when considering project funding. Mining companies constrained by low commodity prices and difficulties in obtaining financing benefit by demonstrating their adherence to these concepts. Stewardship and sustainability concern the natural environments in which the project operates. Two inter-related ways of demonstrating the company’s commitment are the appropriate analyses of their environmental data and the smooth operation of their environmental department.
-
Toxic metals and organic compounds are commonly present at very low concentrations in water, sediments, soils, and rocks. Concentrations cannot be quantified with 99% certainty; if those chemicals are present the instrument cannot distinguish them from zero. Concentrations below laboratory reporting limits are censored because their values are unknown. Censored values can be 70-80% of the available date, a meaningful amount of valuable information. Correct analysis of censored data is particularly important when performing an ecological risk analysis (ERA) as part of the CERCLA Superfund process.
-
R.A. Fisher, a British biologist and statistician created the statistical foundation for testing experimental hypotheses in the 1930s. Environmental data are observational measurements, not experimental measurements. Therefore, the analytical models applied to experimental data produce incorrect results when applied to environmental data. Download the PDF.
-
Environmental Water Quality Data: Analyzing Change Over Time
Categories: Estimated reading time: 3 minutes
Water quality discharge permits require periodic measurement of water quality constituent concentrations to document compliance with permit conditions. In addition to correctly including concentrations below the analytical method’s detection level when describing the distribution of these concentrations there is great value for operators and environmental regulators in properly analyzing the temporal aspects of these data. A single concentration, particularly when it exceeds a standard’s threshold, lacks context and does not assess an operation’s interactions with the natural environment; it is a temporal and spatial snapshot. -
Most people are familiar with statistical hypothesis tests such as the t-test and ANOVA to analyze whether two or more samples (from a parametric distribution) came from the same population. The nonparametric equivalents (Wilcoxon and Kruskal-Wallis tests) are less familiar but equally robust. What is not always clear is that these models are applied to one or more response variables; e.g., chemical concentrations that result from natural or anthropogenic causes. They do not answer the question of why these values were observed.
1 of 3
Next →